File list
This special page shows all uploaded files.
| Date | Name | Thumbnail | Size | Description | Versions |
|---|---|---|---|---|---|
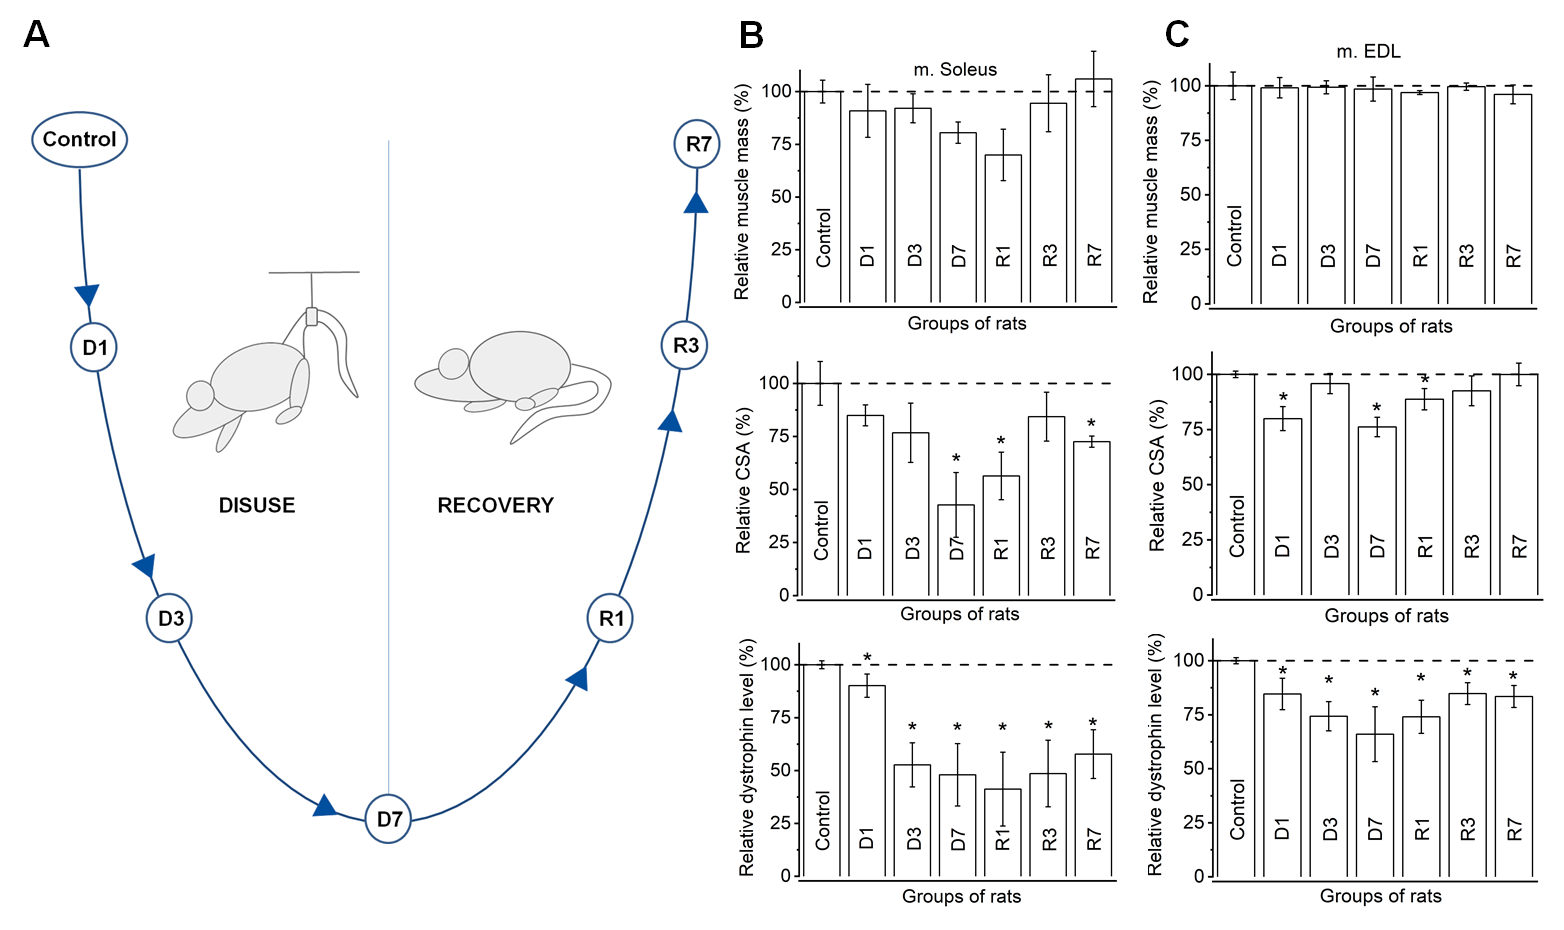
| 11:21, 30 March 2021 | Rat CAGE - Fugure1.png (file) |  |
215 KB | 1 | |
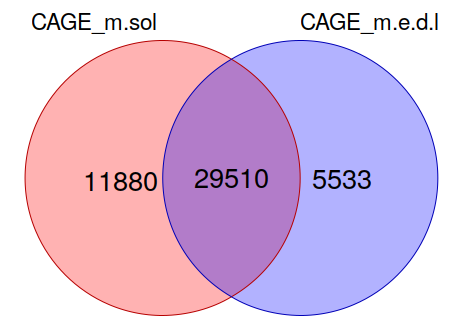
| 18:46, 10 March 2021 | Skeletal human - Figure1.4.png (file) |  |
25 KB | Рис. 1.4. Сопоставление промоторов, обнаруженных в нашем исследовании в m. soleus крысы (показано красным), с промоторами обнаруженными в нашем... | 1 |
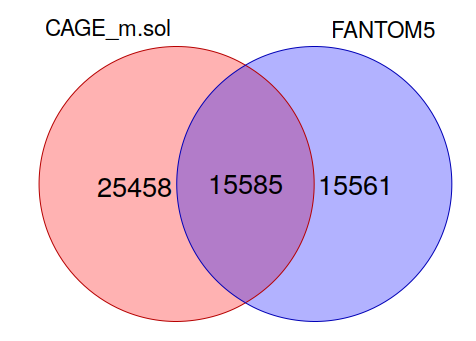
| 10:37, 10 March 2021 | Figure1.3.png (file) |  |
26 KB | Рис. 1.3. Сопоставление промоторов, обнаруженных в нашем исследовании в m. soleus крысы (показано красным), с промоторами, аннотированных для г... | 1 |
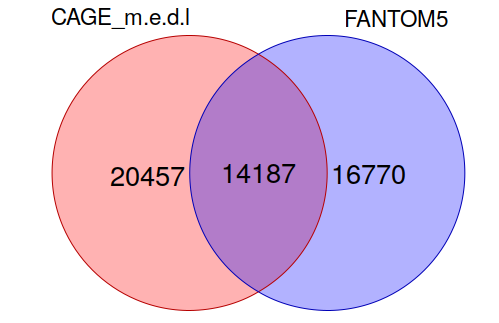
| 09:37, 10 March 2021 | Figure1.2.png (file) |  |
27 KB | Рис. 1.2. Сопоставление промоторов, обнаруженных в нашем исследовании в m. extensor digitorum longus крысы (показано красным), с промоторами, аннотирова... | 1 |
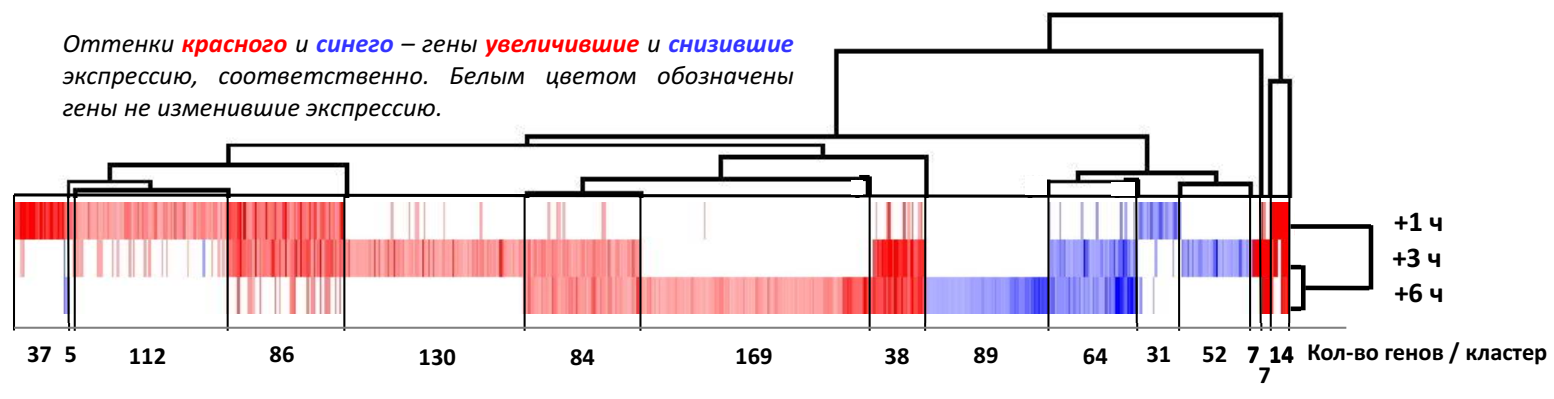
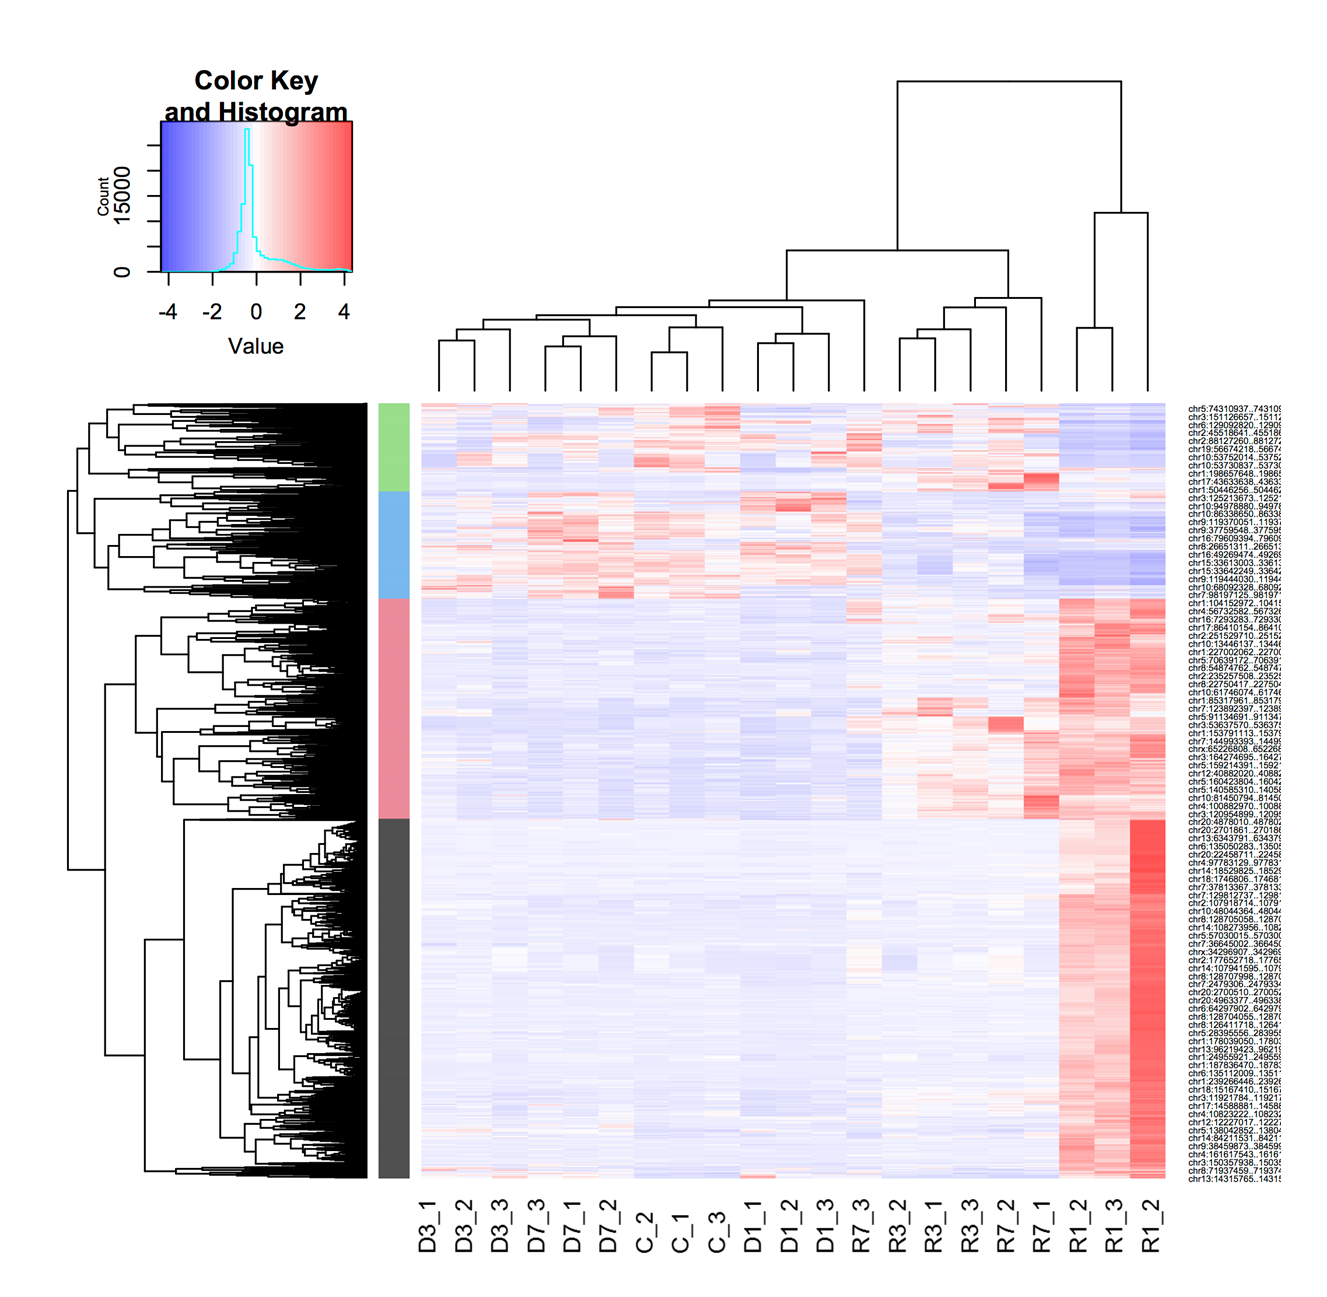
| 09:04, 10 March 2021 | Skeletal human - Figure1.1.png (file) | 131 KB | Рис. 1.1. Группы генов, полученные в результате иерархической кластеризации данных по экспрессии промоторов, активируемых после однократн... | 1 | |
| 13:18, 3 March 2021 | Master regulators - Figure11.png (file) |  |
275 KB | Figure 11. Alternative cell cycle regulators cluster, fast muscle. Top 5 master regulators and their effectors (intermediate nodes not shown). | 1 |
| 13:10, 3 March 2021 | Master regulators - Figure10.png (file) |  |
271 KB | Figure 10. Proteasomal degradation cluster, EDL muscle. Top 5 master regulators and their effectors (intermediate nodes not shown). | 1 |
| 12:59, 3 March 2021 | Master regulators - Figure9.png (file) |  |
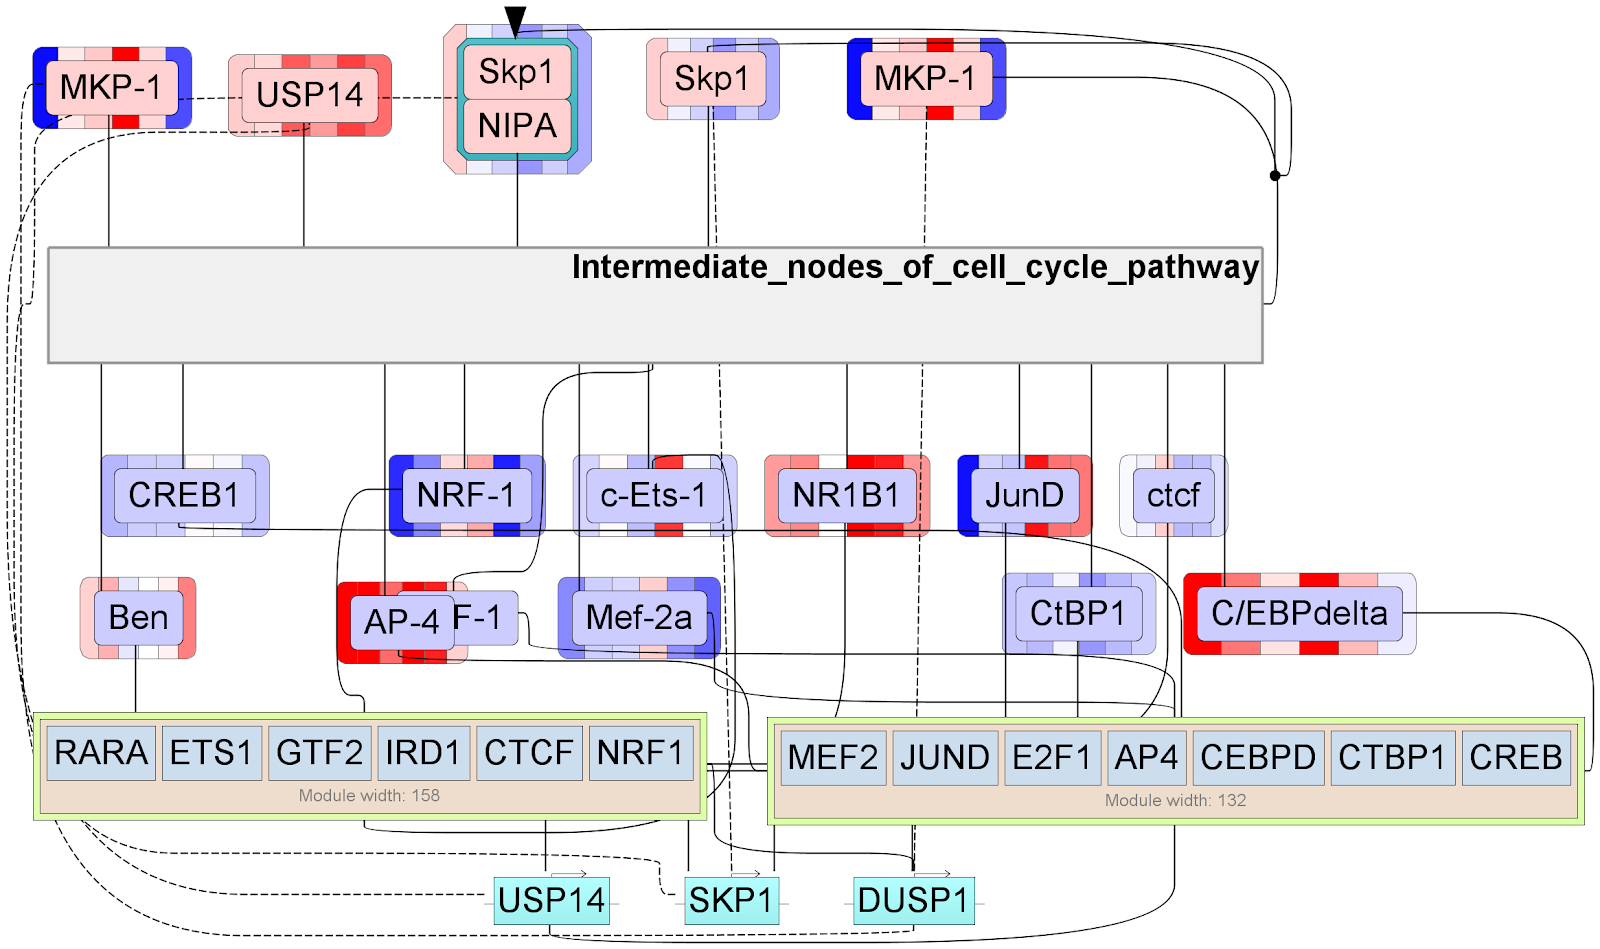
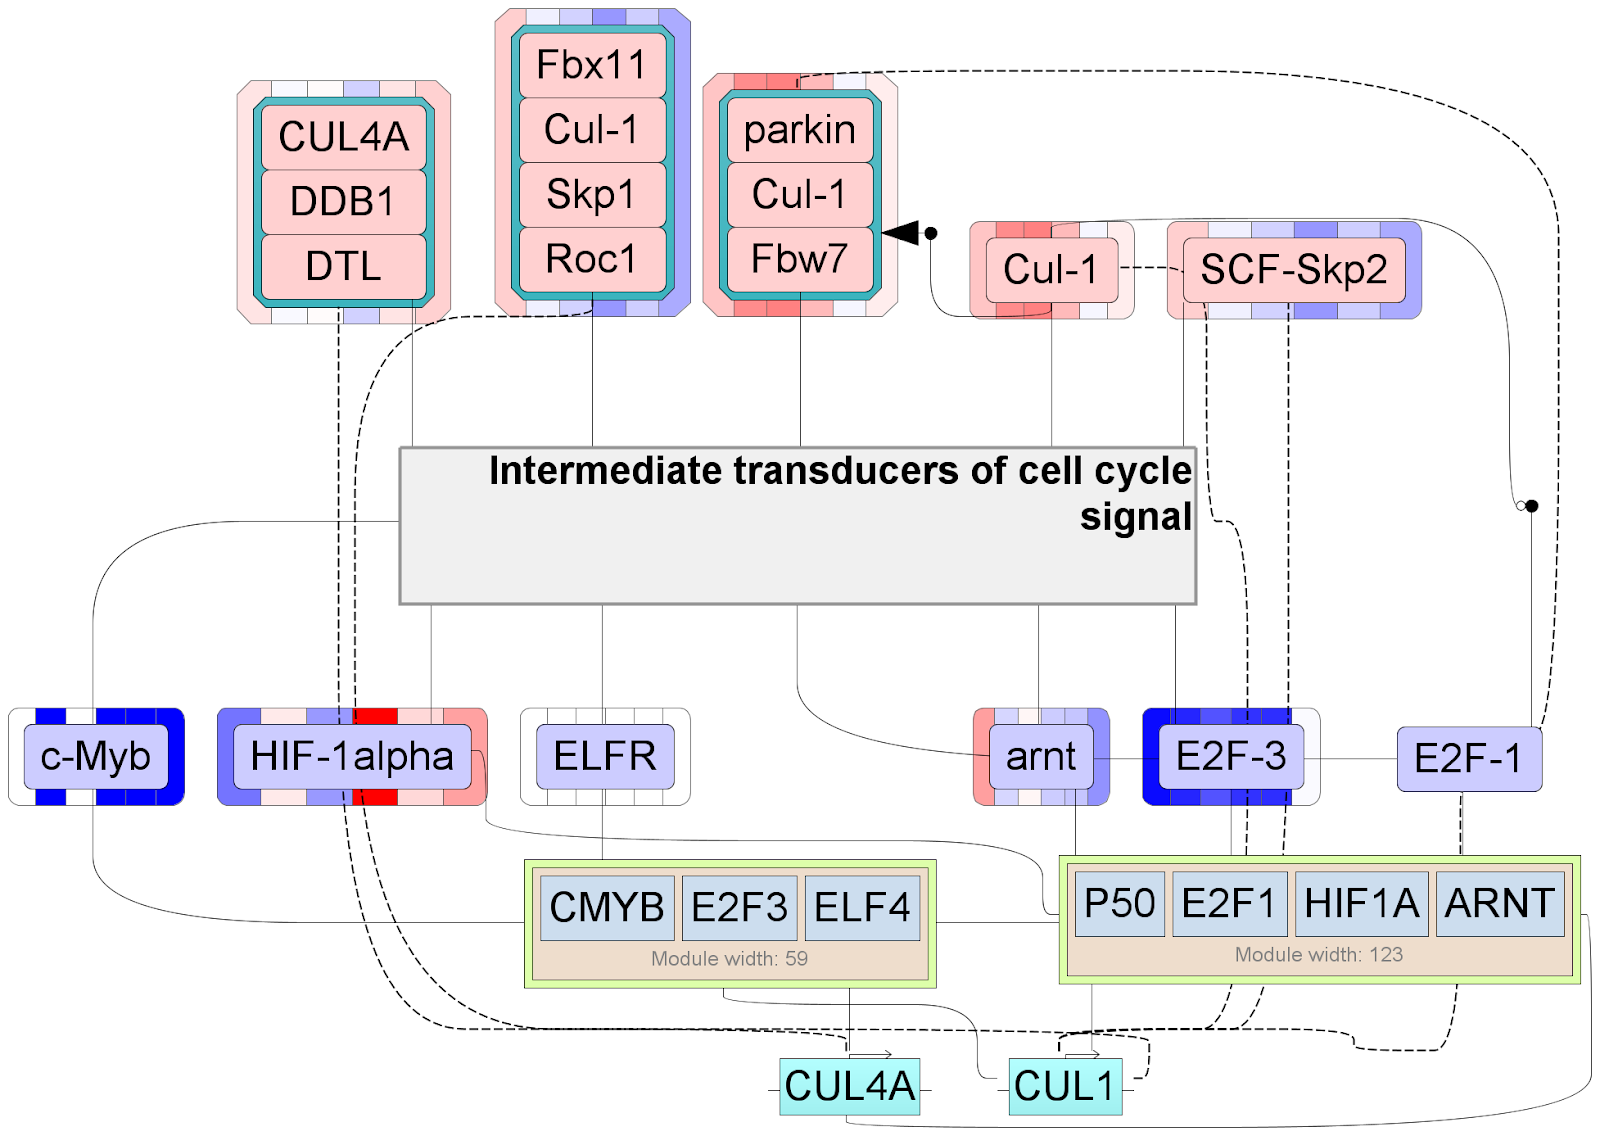
213 KB | Figure 9. Cell cycle cluster, EDL muscle.. Network of top 5 keynode master regulators. | 1 |
| 12:40, 3 March 2021 | Master regulators - Figure8.png (file) |  |
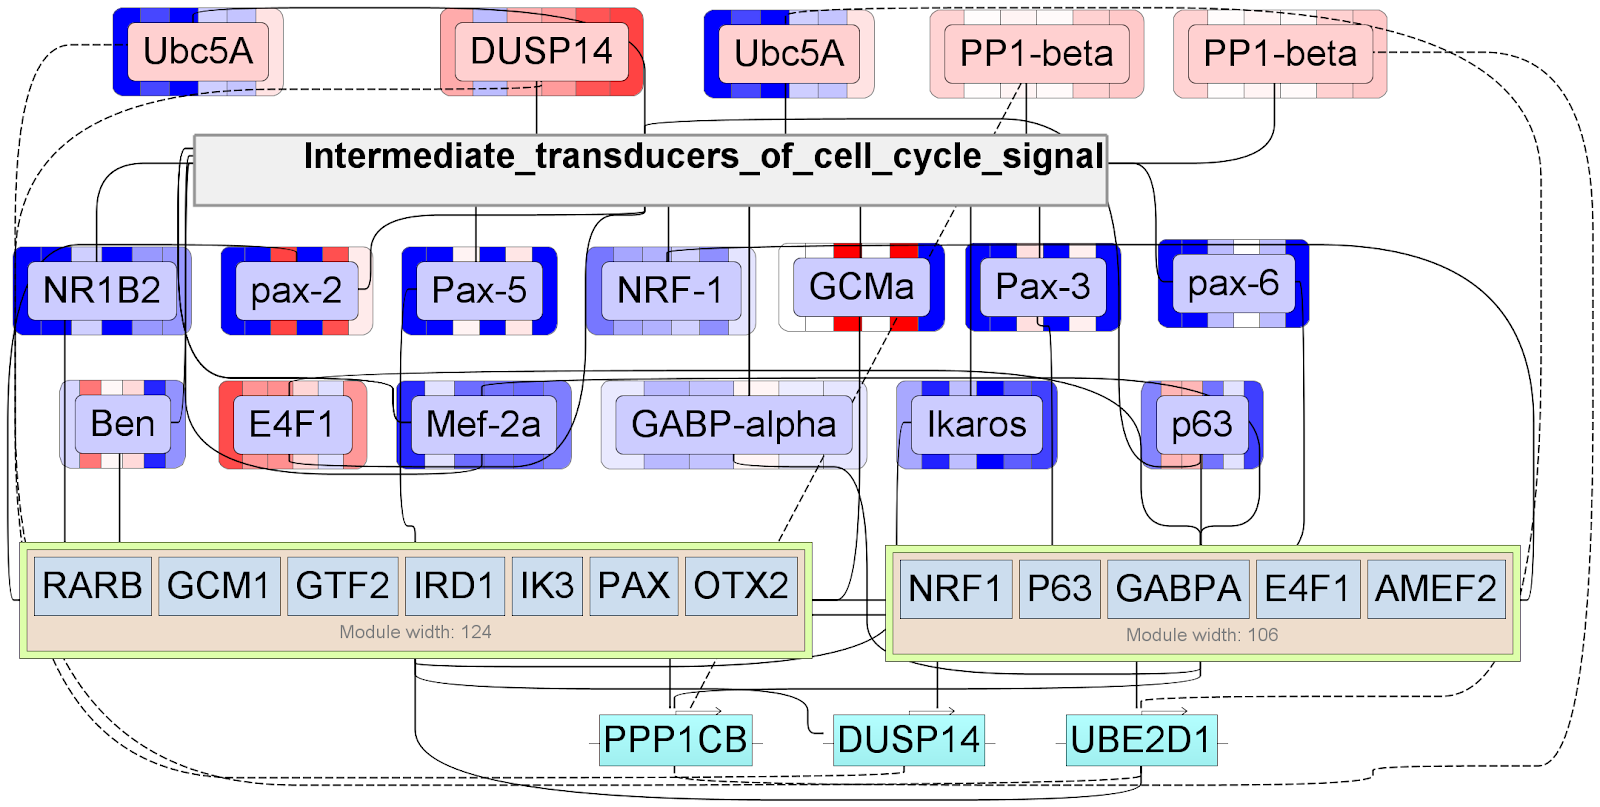
227 KB | Figure 8. Alternative cell cycle related cluster, soleus muscle. Network of top 5 master regulators. | 1 |
| 12:31, 3 March 2021 | Master regulators - Figure7.png (file) |  |
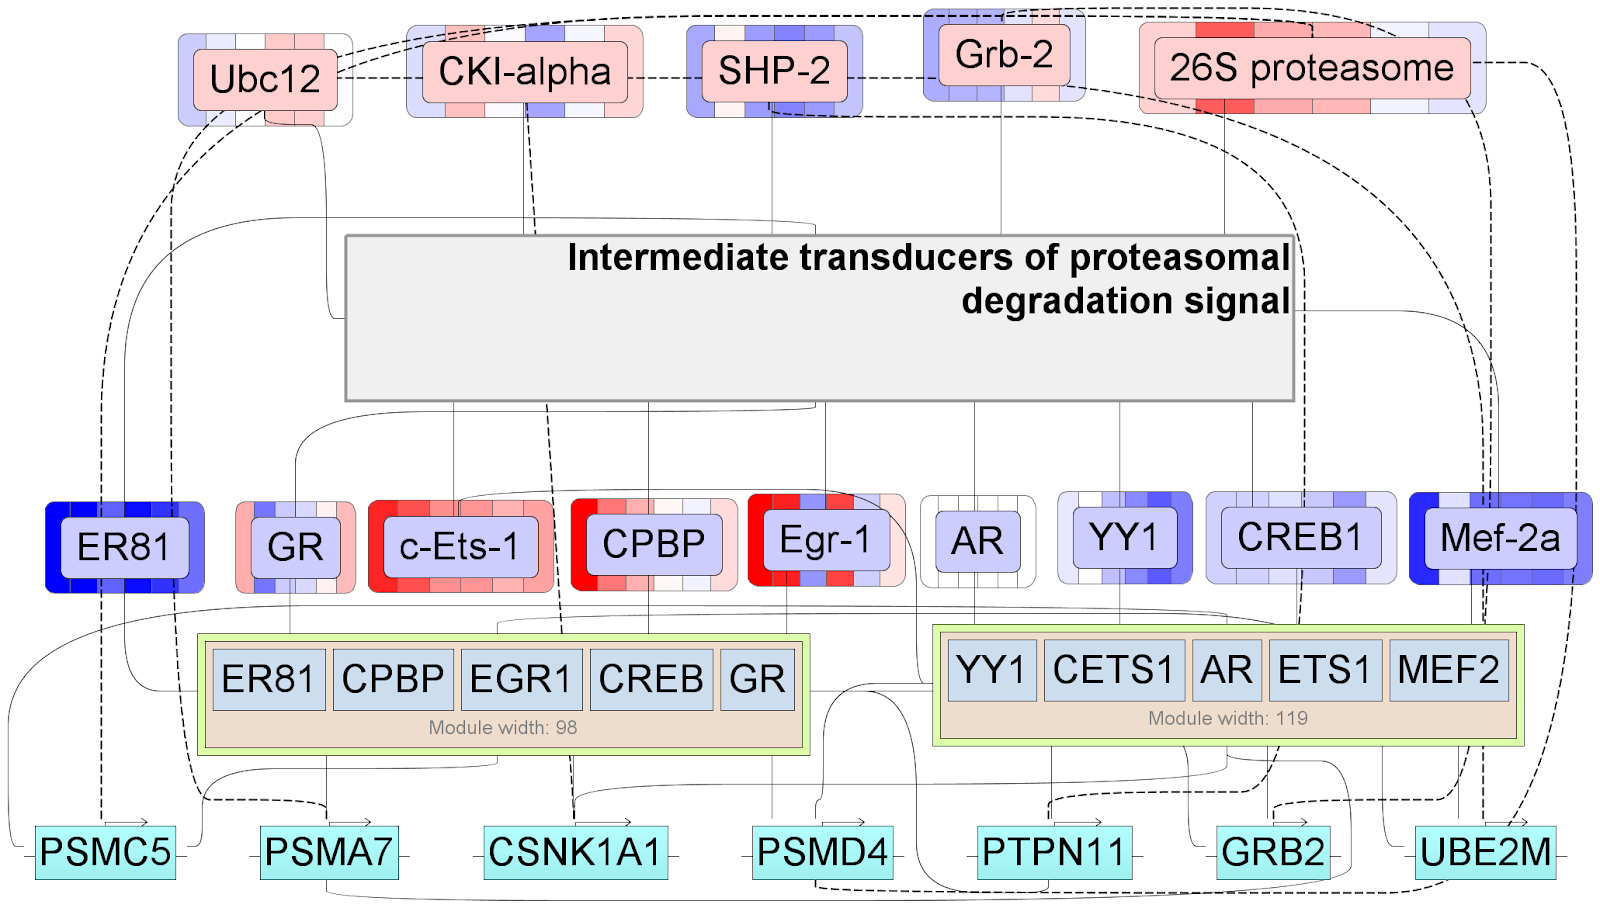
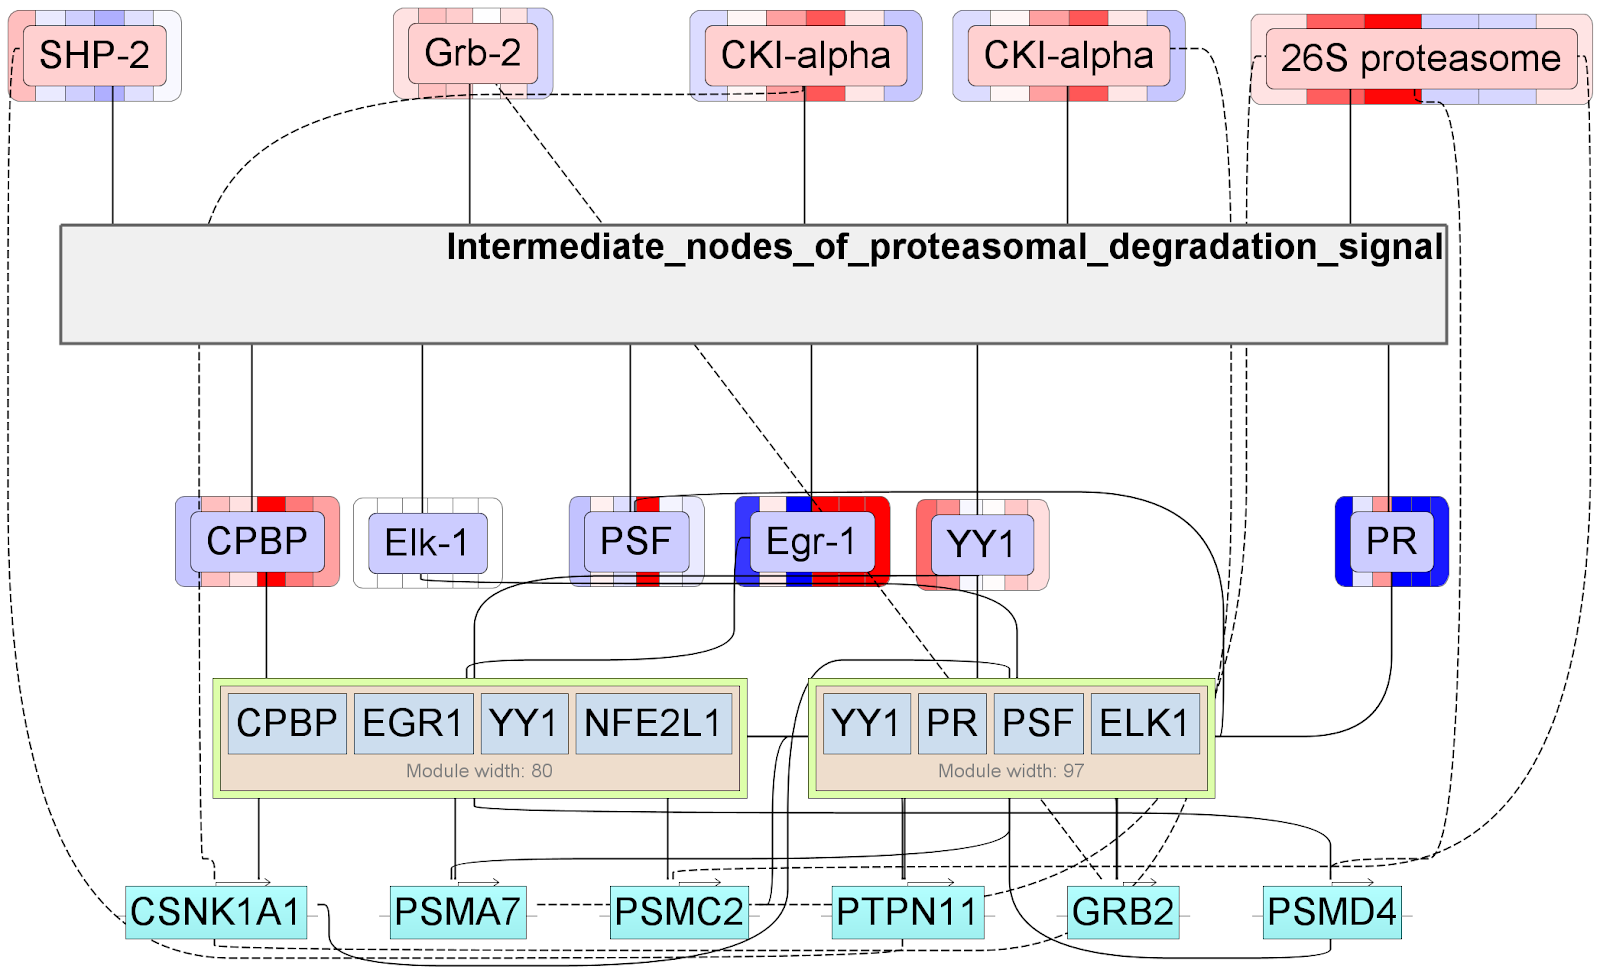
233 KB | Figure 7. Proteasomal degradation (regeneration) cluster, soleus muscle. Network of top 5 master regulators. See SF for complete view with intermediate transducers of proteasomal degradation signal shown | 1 |
| 21:33, 2 March 2021 | Master regulators - FigureMR1.png (file) |  |
212 KB | Proteasomal cluster, soleus muscle. Network of top 5 master regulators. | 1 |
| 16:47, 2 March 2021 | Enhancers - Figure5.png (file) |  |
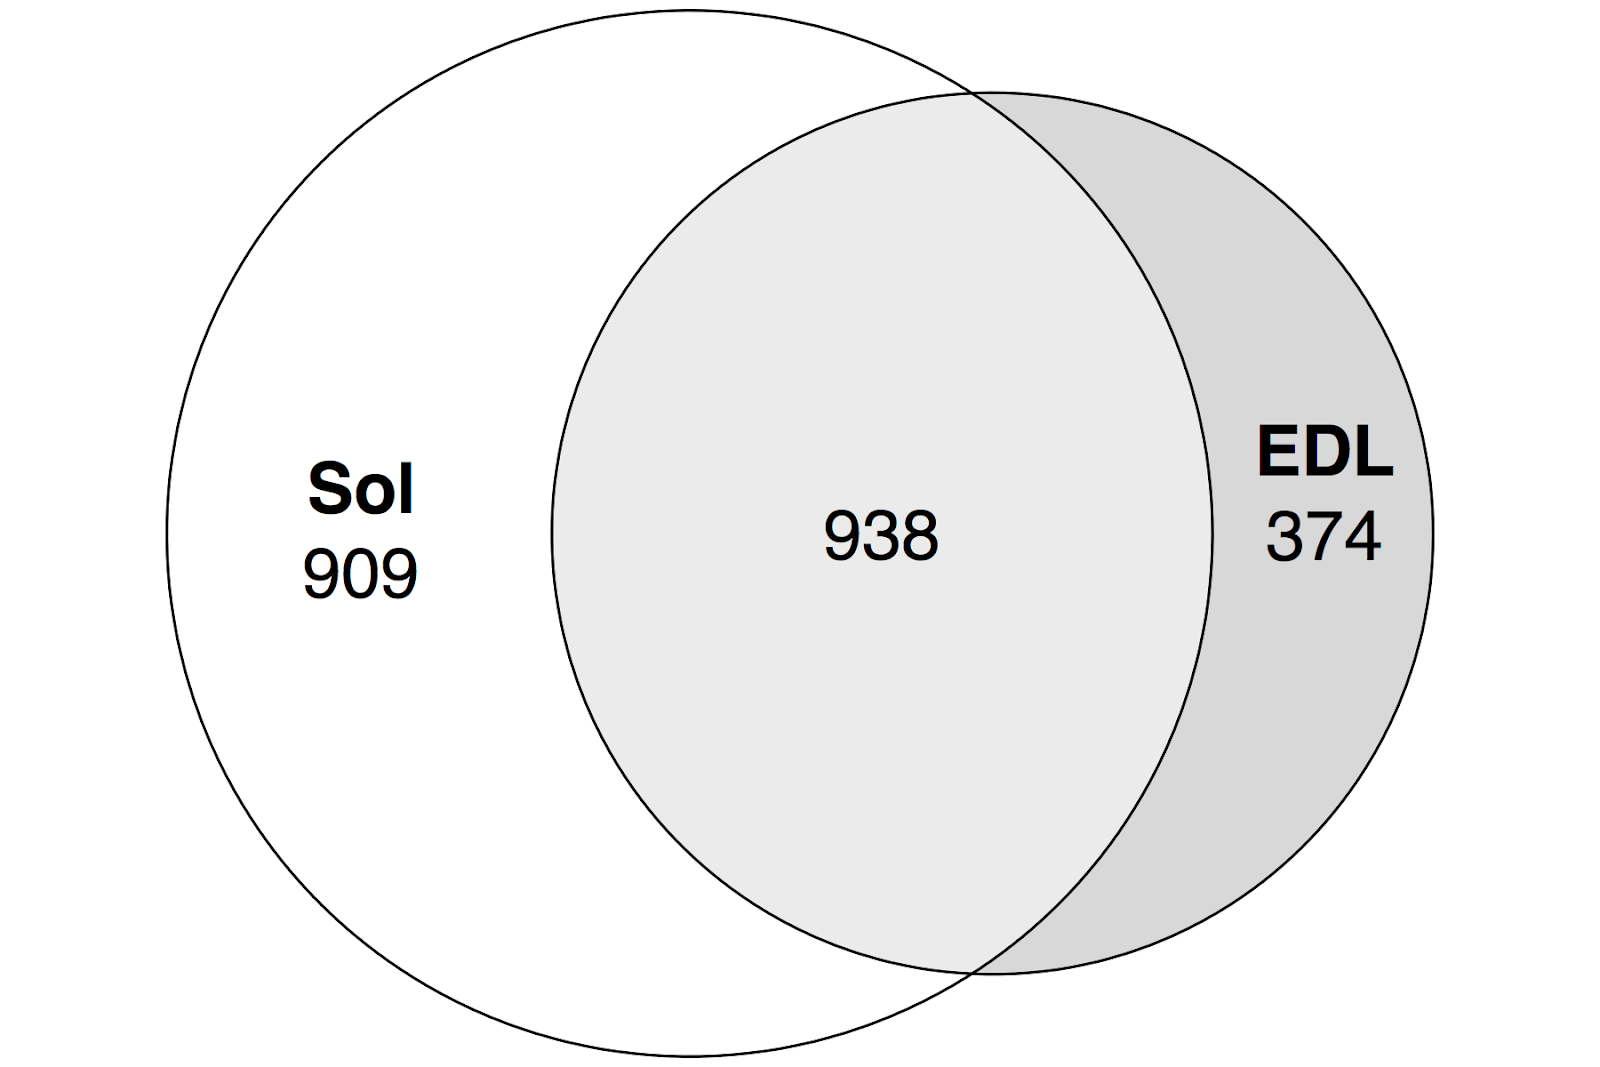
119 KB | Tissue-specific enhancers of soleus and EDL muscles Strandless coordinate intersection with 1nt cutoff | 1 |
| 16:34, 2 March 2021 | Alternative usage of dominating TSS - Figure4.png (file) |  |
83 KB | Alternative TSS in genes Myh4 (A) and Rtkn (B) shown in GTRD web browser. See SF4 for the full figure. | 1 |
| 15:29, 2 March 2021 | TSS and DEGs - Figure3.png (file) |  |
90 KB | Differentially expressed genes (DEGs) and differentially expressed enhancers in soleus and EDL muscles. A. Number of DEGs. B. Number of differentially expressed enhancers. C. DEGs in the fast and slow muscles (as compared to control) on days 1, 3 and 7... | 1 |
| 12:44, 2 March 2021 | Figure2b.png (file) |  |
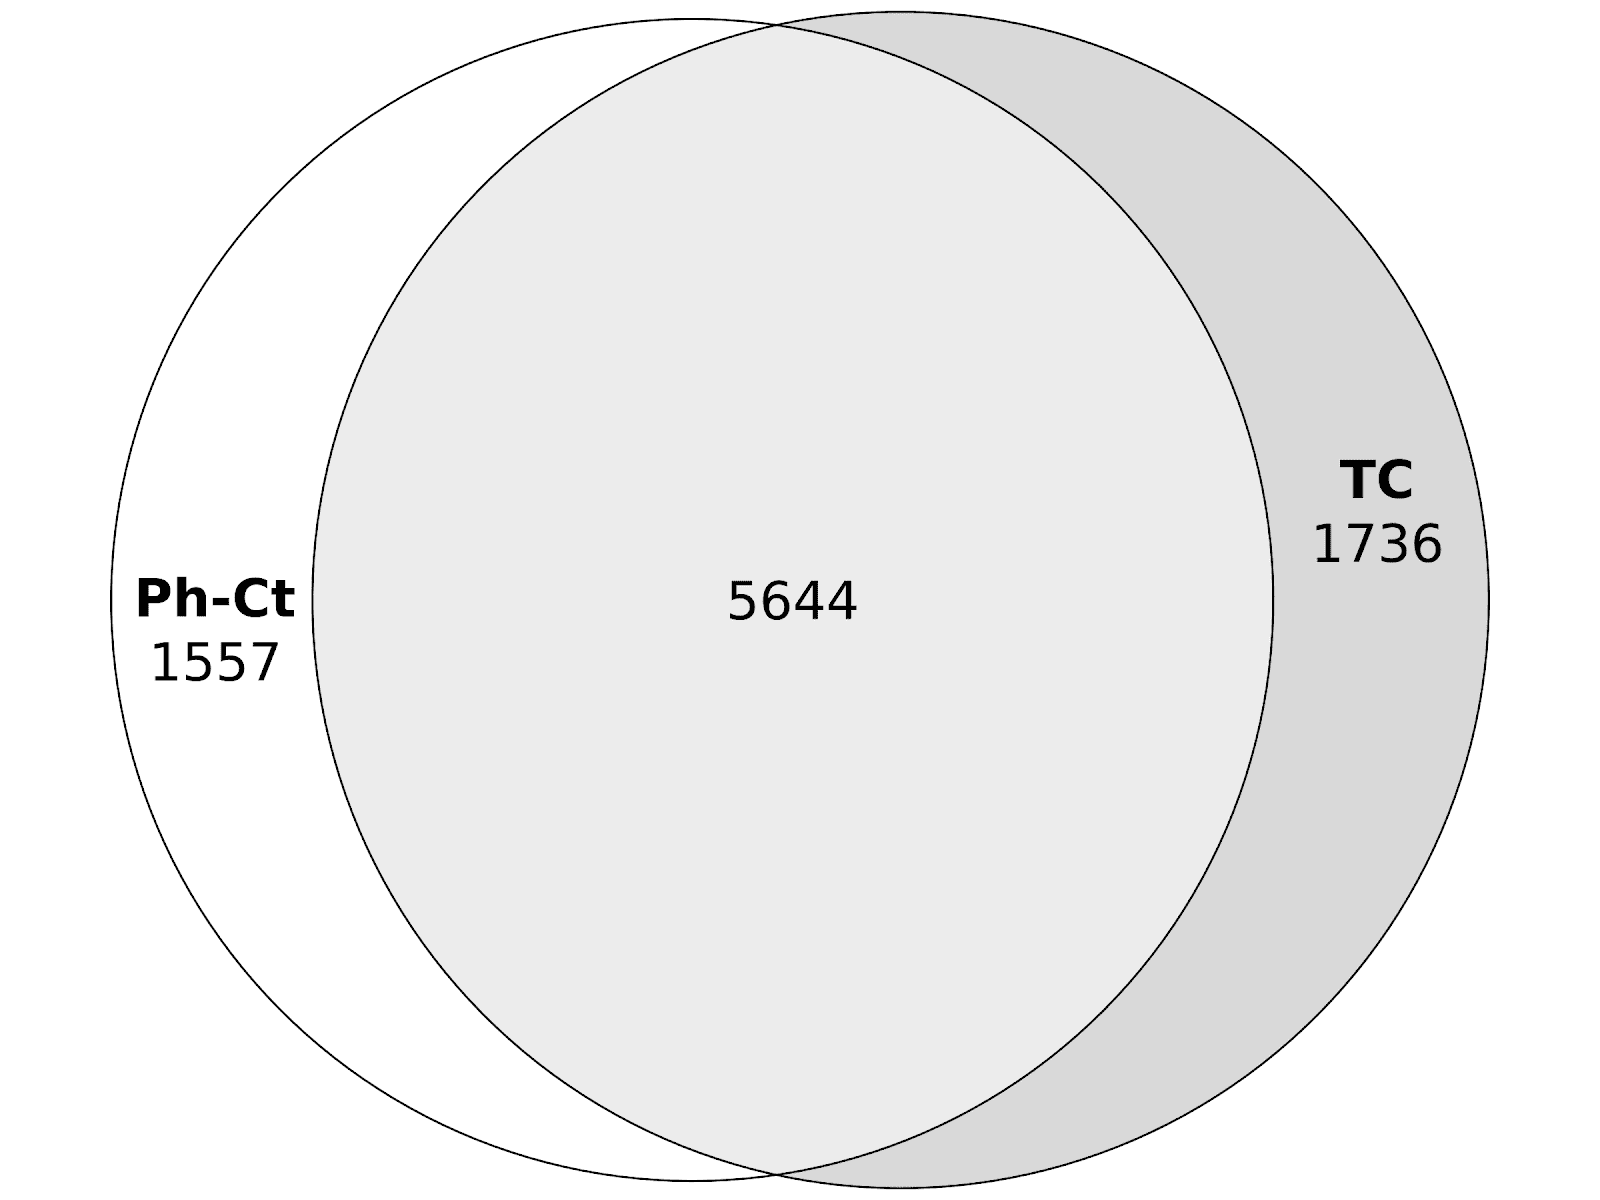
26 KB | Common and unique differentially expressed peaks between phase-control (Ph-Ct) and time course (TC) comparisons. Soleus muscle. FDR threshold 5e-04 | 1 |
| 12:28, 2 March 2021 | TSS and DEGs - Figure2a.png (file) |  |
414 KB | Clusterization of differentially expressed peaks (both genic and intergenic) common to both phase-control and time-course comparisons. FDR threshold 5e-04. Clusters of the metabolism regulation through MAP kinase activity, actin biosynthesis, nucleosom... | 1 |