File:Figure2b.png
From Muscle
Size of this preview: 800 × 600 pixels. Other resolutions: 320 × 240 pixels | 1,600 × 1,200 pixels.
Original file (1,600 × 1,200 pixels, file size: 26 KB, MIME type: image/png)
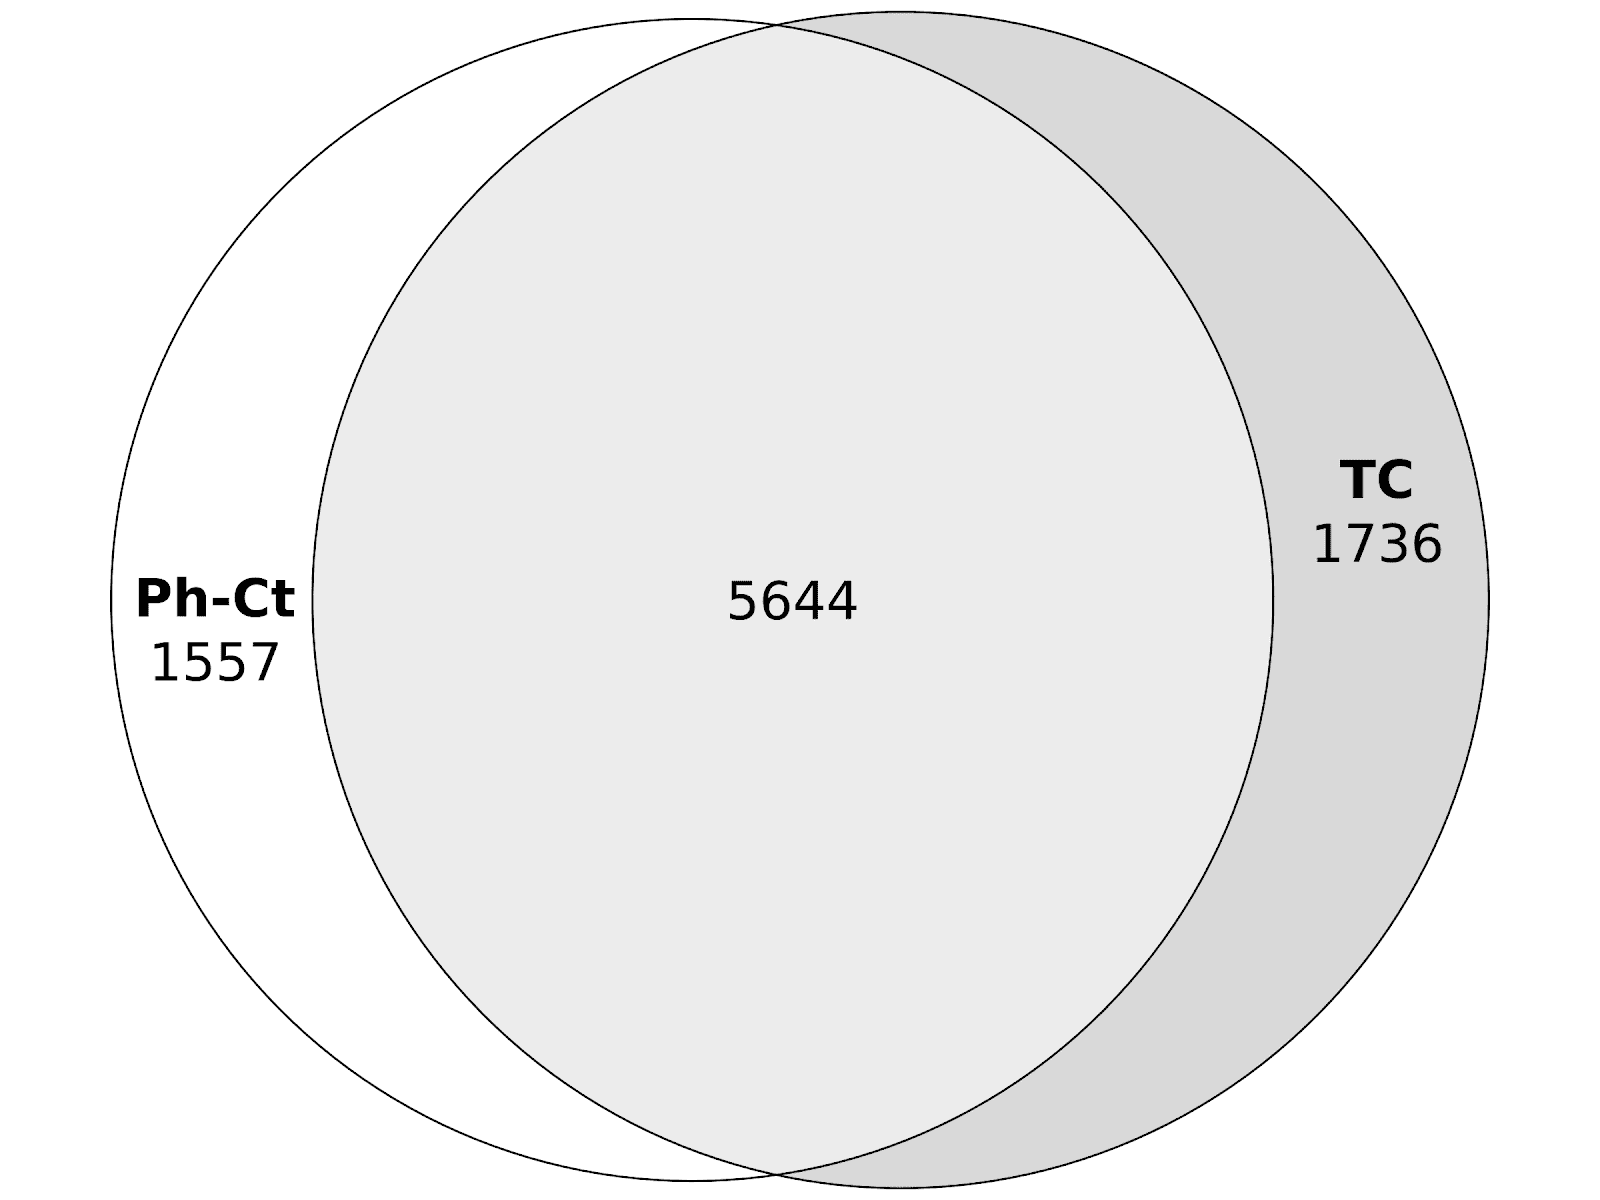
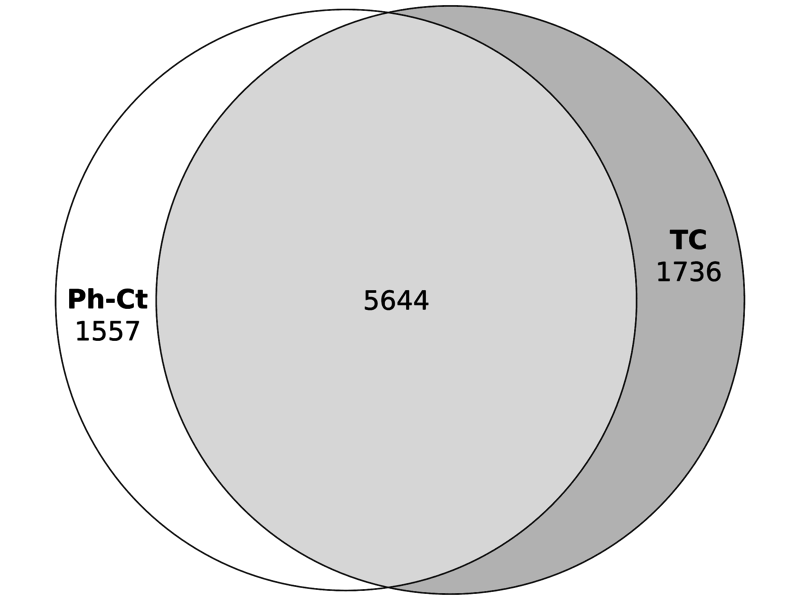
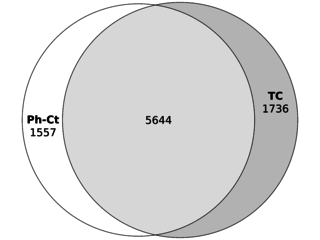
Common and unique differentially expressed peaks between phase-control (Ph-Ct) and time course (TC) comparisons. Soleus muscle. FDR threshold 5e-04
File history
Click on a date/time to view the file as it appeared at that time.
| Date/Time | Thumbnail | Dimensions | User | Comment | |
|---|---|---|---|---|---|
| current | 12:44, 2 March 2021 | | 1,600 × 1,200 (26 KB) | Sspintus@dote.ru (talk | contribs) | Common and unique differentially expressed peaks between phase-control (Ph-Ct) and time course (TC) comparisons. Soleus muscle. FDR threshold 5e-04 |
- You cannot overwrite this file.
File usage
The following page links to this file: