Muscle models
Introduction
Skeletal muscle is one of the most abundant tissues in mammals, accounting for up to 40% of the total mass ofthe human body (Janssen et al., 2000)[1]. The contraction–relaxation cycle in muscle requires energy that is mostly generated aerobically by mitochondria particularly abundant in adult muscle fibres. It is worth to note that skeletal muscle can maintain ATP concentration constant during the transition from rest to exercise, whereas metabolic reaction rates may increase substantially (Kunz, 2001) [2]. Although it is well known that skeletal muscle adaptations to exercise depend on duration, intensity, and frequency, changes in muscle proteins associated with different types of exercise have not been well characterized (Gonzalez‐Freire et al., 2017) [3]. Moreover, the quantitative contributions of different fiber types to the energy demand and detailed dynamics of metabolic responses of the skeletal muscle in response to different exercise intensities are unknown. Indeed, accurate measurements to quantify the recruitment and metabolic activation of muscle fibers in vivo have not been possible to date (Li et al., 2012) [4]. So due to a shortage of dynamic in vivo human data, the regulatory mechanisms of functioning of the skeletal muscle metabolism are poorly understood. To quantitatively interpret the limited data, a physiologically based mathematical modeling approach can be applied (Li et al., 2010) [5].
Published models
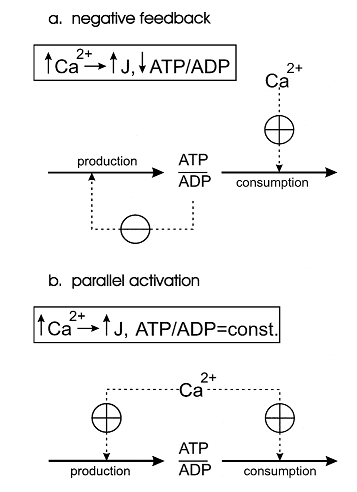
One of the first theoretical investigation in this field was conducted by Bernard Korzeniewski (Korzeniewski, 1998,1999) [6][7]. He developed the computational model of oxidative phosphorylation in skeletal muscle mitochondria in order to decipher a regulatory mechanism of the adjustment of ATP production to ATP consumption in contracting muscle. During the transition from the resting state of muscles to their maximal exercise, there is a great increase in energy demand (ATP consumption). Mitochondrial oxidative phosphorylation is the main process responsible for ATP production in most muscle fibre types under most conditions. Therefore, mitochondria have to ‘know’ in some way how fast should they produce ATP in a given moment of time to meet the rate of energy consumption and to avoid a drastic decrease in cytosolic phosphorylation potential which would hinder muscle contraction.Two alternative mechanisms of the adjusting the energy (ATP) production rate to the energy consumption rate were postulated. They can be called the ‘negative feedback’ and ‘parallel activation’ (Figure 1).
Figure 1 from (Korzeniewski, 1998) [6]. Comparison of the negative feedback and parallel activation mechanisms. (a) Negative feedback; only ATP consumption is activated directly by an external effector (for example calcium ions), while ATP production is activated indirectly, via a significant decrease in the ATP/ADP ratio. (b) Parallel activation ; both ATP consumption and ATP production are directly activated by an external effector; the ATP/ADP ratio remains approximately constant.
The model of oxidative phosphorylation in skeletal muscle mitochondria showed that the only quantitatively valid explanation of the existing experimental data is that the parallel activation of different steps constitutes the main mechanism responsible for the adjustment of the ATP production rate to the current energy demand in working muscle and that the intuitive interpretations based on the negative feedback mechanism, although qualitatively logical, do not work when quantitative changes in fluxes and metabolite concentrations as well as the kinetic properties of mitochondria are taken into account.
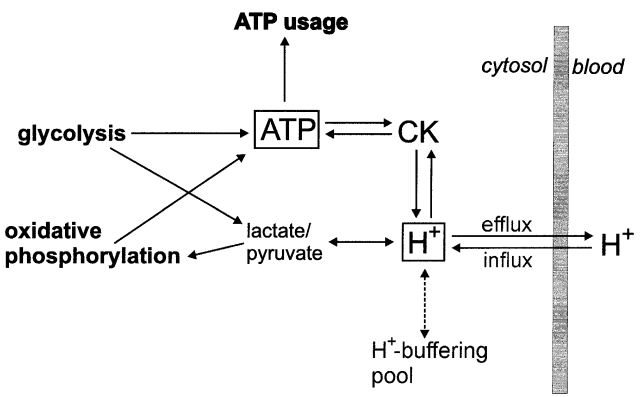
At the next step the comprehensive model of glycolysis in skeletal muscle developed by Lambeth and Kushmerick (Lambeth and Kushmerick, 2002)[8], describing the glycolytic flux as a function of [ADP], [AMP], [ATP] and [Pi], was incorporated to the model of oxidative phosphorylation in intact skeletal muscle (Korzeniewski and Liguzinski, 2004)[9].
Figure 2 from (Korzeniewski and Liguzinski, 2004)[9]. Scheme of processes producing, consuming and buffering cytosolic ATP and H+ in skeletal muscle.
Computer simulations presented in the study were performed either using the model of oxidative phosphorylation plus comprehensive model of glycolysis (these mode of simulations was called Mode 0) or the model of oxidative phosphorylation containing the simple kinetic description of the glycolytic flux as a function of ADP concentration. In the latter case, three further modes of simulations were used:
1) in Mode 1, no ATP and H+ production by anaerobic glycolysis is involved (it is assumed that the pyruvate/lactate/proton production by glycolysis is always equal to the pyruvate/lactate/proton consumption by oxidative phosphorylation);
2) in Mode 2, only the dependence of the glycolytic flux on ADP and the direct activation of glycolysis during muscle contraction are included;
3) in Mode 3, the glycolytic flux is described as depending on both ADP and H+, and is also directly activated during muscle contraction. Thus, the production of ATP and H+ by anaerobic glycolysis is allowed in Mode 2 and Mode 3.
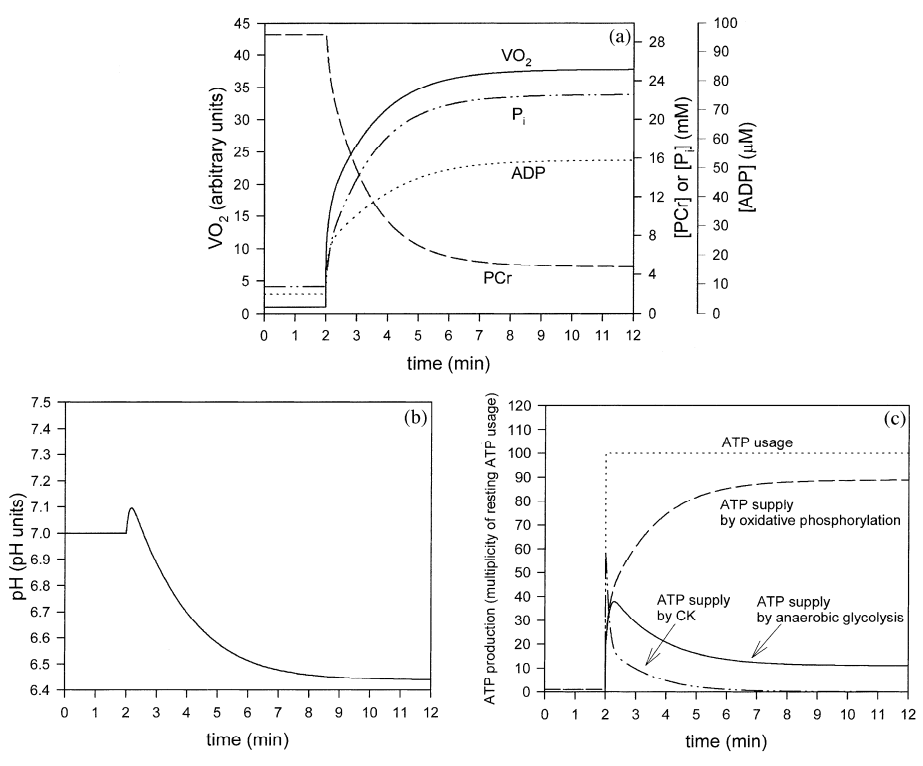
Generally, it can be concluded that Mode 3 (dependence of glycolysis on ADP and H+) gives predictions much better matching experimental results than the predictions produced within Mode 2 (dependence of glycolysis on ADP only). Namely, the simulations in Mode 3 predict the transient activation of anaerobic glycolysis and the proper extent and duration of the initial alkalization. Therefore, it can be concluded that the regulation of glycolysis in muscle during transition from rest to work is a result of the dynamic balance between the activation of this metabolic pathway by ADP, AMP, Pi and alkalization, direct activation by some cytosolic factor during muscle contraction and the inhibition of glycolysis by acidification.
Figure 3 from (Korzeniewski and Liguzinski, 2004) [9].Simulated behavior of the bioenergetic system in muscle in Mode 3 during transition from rest to intensive exercise. Mode 3: direct activation of glycolysis during muscle contraction, activation of glycolysis by ADP (plus AMP and Pi), inhibition of glycolysis by H+. After first 2 min of simulation, representing resting steady-state, ATP usage was increased 100 times. In the same moment, glycolysis was directly activated 1000.8 times and oxidative phosphorylation was activated 1000.4 times. (a) time courses of VO2 (standardized for 1 in resting state), ADP, PCr and Pi; (b) time course of cytosolic pH; (c) time courses of ATP usage, ATP supply by creatine kinase, ATP supply by anaerobic glycolysis and ATP supply by oxidative phosphorylation (including aerobic glycolysis).
It must be emphasized that the computer model of oxidative phosphorylation+glycolysis used in the present study contains several simplifications and approximations. First, a simple linear dependence of the glycolytic flux on [ADP] was extracted from the initial model (Lambeth and Kushmerick, 2002)[8]. This was justified by the fact that the regulation by ADP, AMP and Pi cannot alone account for the kinetic properties of glycolysis in intact muscle. Such a simple description allowed including in the model the direct activation of glycolysis by some contraction-related factor and the inhibition of this process by protons. Second, a simple linear dependence of the glycolytic flux on [H+] was assumed. However, the real dependence may be more complicated. This may be the reason why the simulated initial transient activation of anaerobic glycolysis lasts a little longer than in reality, and, consequently, causes a longer transition of VO2 to the active steady-state than that observed in experimental studies (Ceretelli et al., 1979)[10]; (Hughson et al., 2001)[11]. Third, a simplified kinetic description of the direct activation of glycolysis (n^x) was used. Fourth, the slow component in the oxygen uptake kinetics, observed in the intact muscle above the lactate threshold (Whipp and Wasserman, 1972), is not taken into account within the model. Fifth, it is assumed that oxidative phosphorylation is directly activated by some external cytosolic factor (e.g. calcium ions) instantly after an onset of exercise. This is the reason of the very quick initial increase in the respiration rate. However, this is most probably only a rough approximation of the real situation, because calcium needs some time to enter mitochondria and to activate mitochondrial enzymes. Thus, this model can be improved and extended in many aspects and directions. First, a complete, detailed kinetic description of the tricarboxylate acid cycle (TCA), glycolysis and fatty acid hoxidation can be incorporated into this model. Second, the model can be extended in order to simulate the behavior of the system during extremely intensive short-term exercise, where anaerobic glycolysis is the predominant source of ATP (Korzeniewski and Liguzinski, 2004)[9].
References
- Janssen I, Heymsfield SB, Wang ZM, and Ross R. Skeletal muscle mass and distribution in 468 men and women aged 18-88 yr. J Appl Physiol (1985). 2000 Jul;89(1):81-8. DOI:10.1152/jappl.2000.89.1.81 |
- Kunz WS. Control of oxidative phosphorylation in skeletal muscle. Biochim Biophys Acta. 2001 Mar 1;1504(1):12-9. DOI:10.1016/s0005-2728(00)00235-8 |
- Gonzalez-Freire M, Semba RD, Ubaida-Mohien C, Fabbri E, Scalzo P, Højlund K, Dufresne C, Lyashkov A, and Ferrucci L. The Human Skeletal Muscle Proteome Project: a reappraisal of the current literature. J Cachexia Sarcopenia Muscle. 2017 Feb;8(1):5-18. DOI:10.1002/jcsm.12121 |
- Li Y, Lai N, Kirwan JP, and Saidel GM. Computational Model of Cellular Metabolic Dynamics in Skeletal Muscle Fibers during Moderate Intensity Exercise. Cell Mol Bioeng. 2012 Mar;5(1):92-112. DOI:10.1007/s12195-011-0210-y |
- Li Y, Solomon TP, Haus JM, Saidel GM, Cabrera ME, and Kirwan JP. Computational model of cellular metabolic dynamics: effect of insulin on glucose disposal in human skeletal muscle. Am J Physiol Endocrinol Metab. 2010 Jun;298(6):E1198-209. DOI:10.1152/ajpendo.00713.2009 |
- Korzeniewski B. Regulation of ATP supply during muscle contraction: theoretical studies. Biochem J. 1998 Mar 15;330 ( Pt 3)(Pt 3):1189-95. DOI:10.1042/bj3301189 |
- Korzeniewski B. Theoretical studies on how ATP supply meets ATP demand. Biochem Soc Trans. 1999 Feb;27(2):271-6. DOI:10.1042/bst0270271 |
- Lambeth MJ and Kushmerick MJ. A computational model for glycogenolysis in skeletal muscle. Ann Biomed Eng. 2002 Jun;30(6):808-27. DOI:10.1114/1.1492813 |
- Korzeniewski B and Liguzinski P. Theoretical studies on the regulation of anaerobic glycolysis and its influence on oxidative phosphorylation in skeletal muscle. Biophys Chem. 2004 Jul 1;110(1-2):147-69. DOI:10.1016/j.bpc.2004.01.011 |
- Cerretelli P, Pendergast D, Paganelli WC, and Rennie DW. Effects of specific muscle training on VO2 on-response and early blood lactate. J Appl Physiol Respir Environ Exerc Physiol. 1979 Oct;47(4):761-9. DOI:10.1152/jappl.1979.47.4.761 |
- Hughson RL, Tschakovsky ME, and Houston ME. Regulation of oxygen consumption at the onset of exercise. Exerc Sport Sci Rev. 2001 Jul;29(3):129-33. DOI:10.1097/00003677-200107000-00008 |
- Whipp BJ and Wasserman K. Oxygen uptake kinetics for various intensities of constant-load work. J Appl Physiol. 1972 Sep;33(3):351-6. DOI:10.1152/jappl.1972.33.3.351 |


