Difference between revisions of "Dynamics of activation"
(→Data for model validation, [H+]) |
(→The rate of muscles glycolysis in general) |
||
| Line 70: | Line 70: | ||
| − | [[File: Walter_1999,_In_vivo_ATP_synthesis_rates_in_single_human_muscles_during_high_intensity_exercise_Calculations.png | | + | [[File: Walter_1999,_In_vivo_ATP_synthesis_rates_in_single_human_muscles_during_high_intensity_exercise_Calculations.png | 500px | Calculation of glycolytic ATP synthesis]] |
| − | |||
| − | |||
=== Dynamics of the activity of some glycolytic enzymes === | === Dynamics of the activity of some glycolytic enzymes === | ||
Revision as of 22:23, 30 March 2021
For model validation, dynamics of activation, ATP, PCr, glycolysis, oxidative phosphorylation. Ver. 1.0.
Contents
The rate of muscles ATP hydrolysis
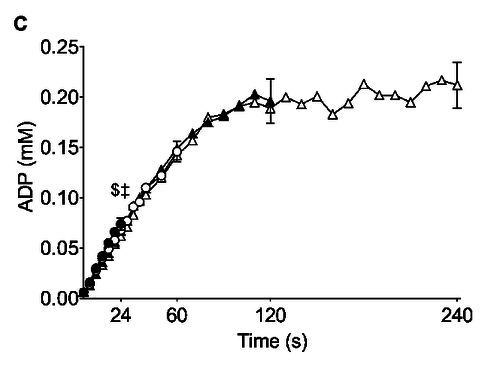
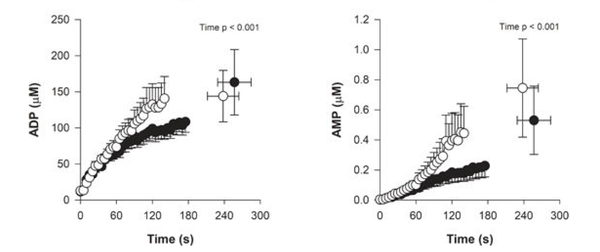
The rate of muscles ATP hydrolysis with a stepwise increase in external load increases almost immediately (as seen by the rate of ADP formation) (Broxterman et al., 2017 [1]; Bartlett et al., 2020 [2]):
Figure from (Bartlett et al., 2020) [2], Changes in muscle ADP across time during trials.
Figure from (Broxterman et al., 2017) [1], Changes in muscle ADP across time.
The rate of muscles PCr hydrolysis
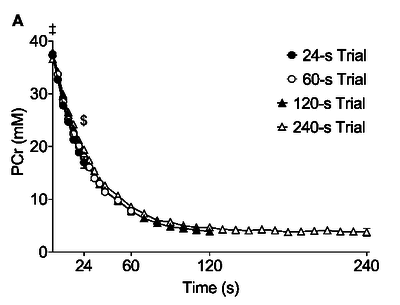
The rate of muscles PCr hydrolysis with a stepwise increase in external load increases almost immediately (Layec et al., 2008 [3]; Cannon et al., 2014 [4]; Fiedler et al., 2016 [5]; Broxterman et al., 2017 [1]; Bartlett et al., 2020 [2]).
Changes in muscle PCr across time
Figure from (Layec et al., 2008) [3], Changes in muscle PCr across time
Figure from (Bartlett et al., 2020) [2], Changes in muscle PCr across time during trials
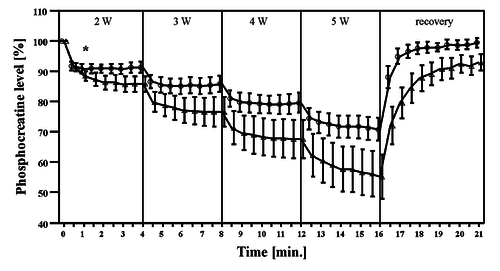
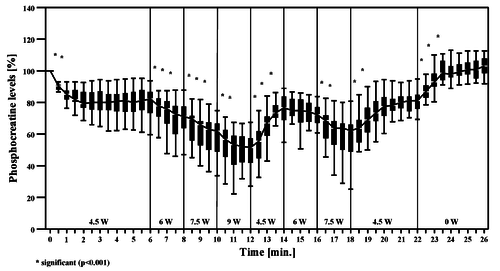
In tests with a stepwise increase in external load, the following dynamics of changes in the PCr concentration is observed (Schocke et al., 2005 [6]; Greiner et al., 2007 [7]).
Figure from (Greiner et al., 2007) [7], changes in the PCr concentration across time
Figure from (Schocke et al., 2005) [6], changes in the PCr concentration across time According to those data, with a frequent stepwise increase or with a gradual increase in external load, the rate of PCr hydrolysis should be constant.
The rate of muscles glycolysis in general
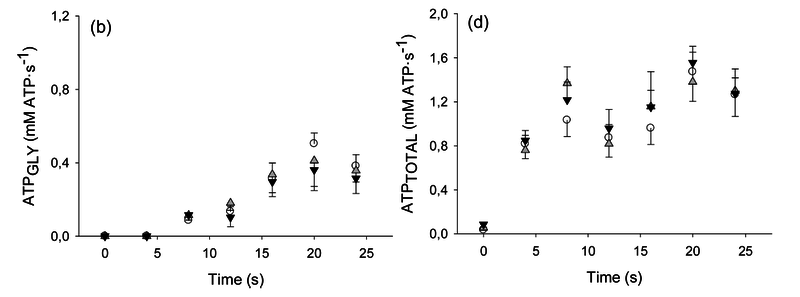
Figure from (Larsen et al., 2014) [8], Rates of ATP synthesis during a 24-s maximal voluntary knee extension contraction (MVC), ATP provision from glycolysis (B, ATPGLY).
Calculation of glycolytic ATP synthesis from (Larsen et al., 2014) [8]:
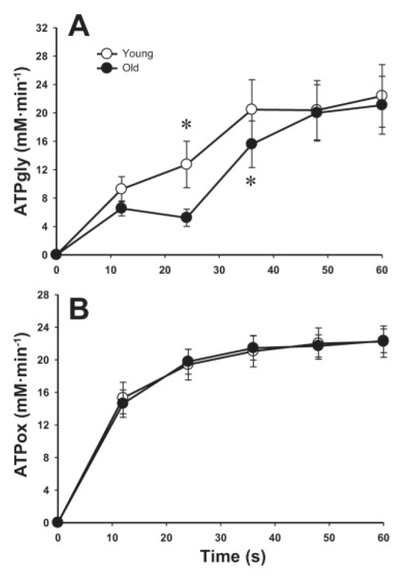
Figure from (Layec et al., 2015) [9], The rate of ATP synthesis through anaerobic glycolysis (A), oxidative phosphorylation (B)
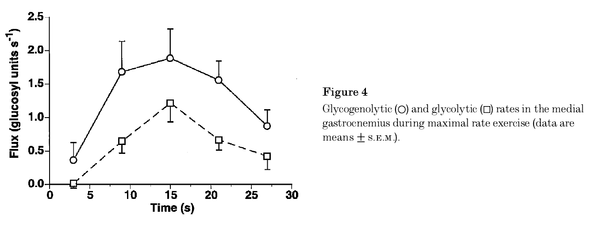
Figure from (Walter et al., 1999) [10], Glycogenolytic and glycolytic rates in the medial gastrocnemius during maximal rate exercise.
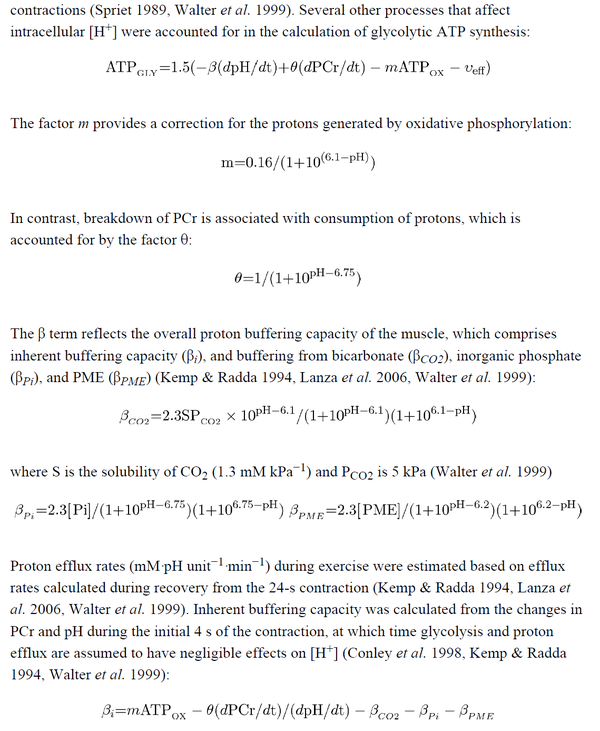
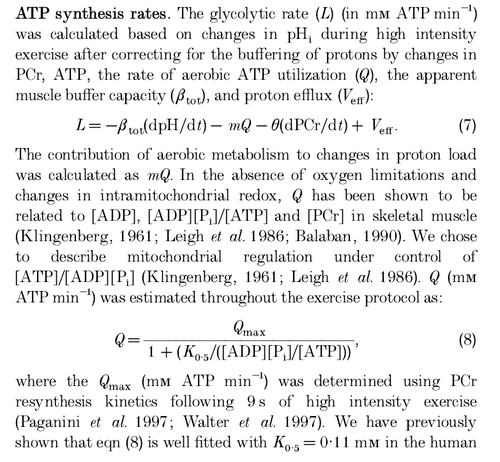
Calculation of glycolytic ATP synthesis from (Walter et al., 1999) [10]:
Dynamics of the activity of some glycolytic enzymes
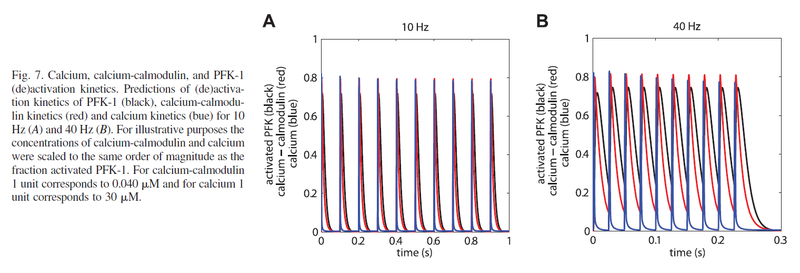
Calcium-regulated PFK-1 activity increases almost instantly (Schmitz et al., 2013) [11].
Figure from (Schmitz et al., 2013) [11], PFK-1 (de)activation kinetics
The PFK-1 activity is regulated by metabolites also
Figure from (Schmitz et al., 2013) [11], Schematic representation of the regulation of PFK-1 as modeled in each model configuration. Model configuration (B) represented the hypothesis in which binding of calcium-calmodulin complexes to PFK-1 partly reliefs ATP inhibition of the enzyme independent of the levels of ADP and AMP. Model configuration (C) represented the hypothesis in which binding of calcium-calmodulin complexes partly reliefs ATP inhibition by enhancing the competitive binding of AMP and ADP to the inhibitory ATP site.
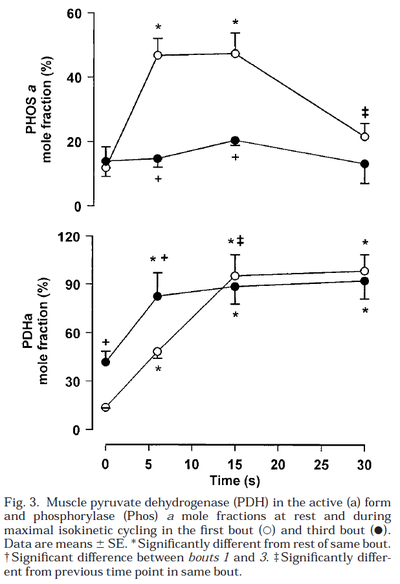
Glycogen phosphorylase and PDH activity increases within seconds (Parolin et al., 1999) [12].
Figure from (Parolin et al., 1999) [12], Regulation of skeletal muscle glycogen phosphorylase and PDH during maximal intermittent exercise.
Dynamics of oxidative phosphorylation activity at the onset of exercise
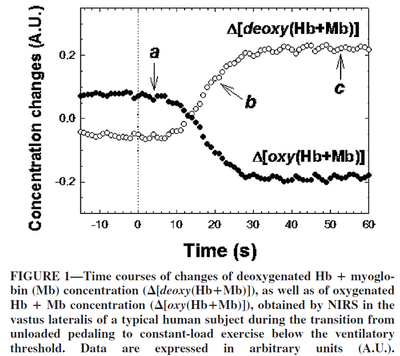
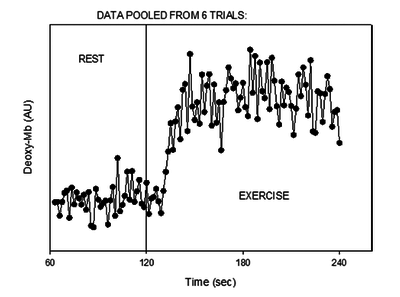
Despite the sufficient amount of oxygen bound to myoglobin in the muscles, oxidative phosphorylation begins with some delay with a stepwise increase in load (Grassi et al., 2005 [13]; Richardson et al., 2015 [14]) with a time lag of about 10 seconds.
Figure from (Grassi et al., 2005) [13], Time courses of changes of deoxygenated Hb + Mb concentration, as well as of oxygenated Hb + Mb concentration.
Figure from (Richardson et al., 2015) [14], Tracing of the deoxygenated myoglobin (deoxy-Mb) signal at the onset of moderate-intensity exercise.
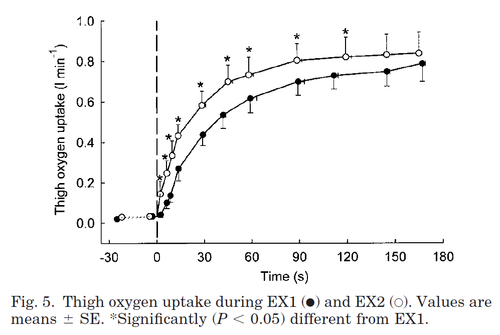
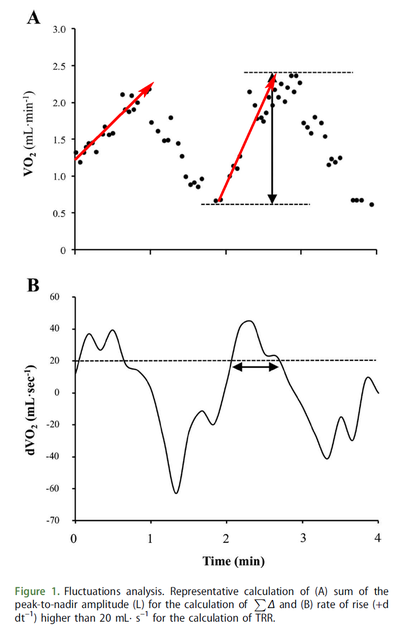
During repeated exercise, the oxygen-uptake rate increases faster compared to the first bout of exercise. This must be taken into account when modelling intermittent loads.
Figure from (Bangsbo et al., 2001) [15], Thigh oxygen uptake during EX1 and EX2.
Figure from (Combes et al., 2016) [16], VO2 fluctuations for each exercise transition
Data for model validation, [H+]
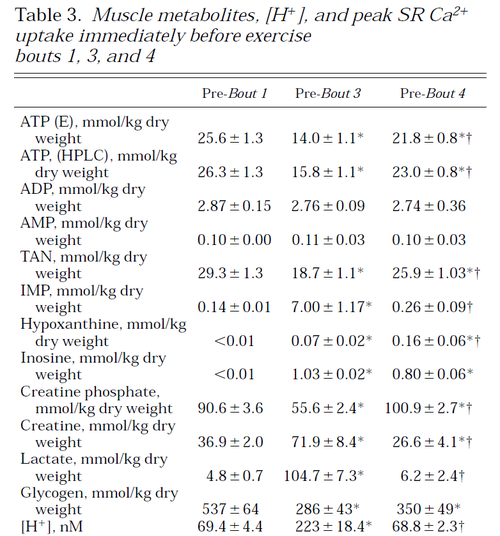
Table from (Hargreaves et al., 1998) [17].
Table from (Hargreaves et al., 1998) [17].
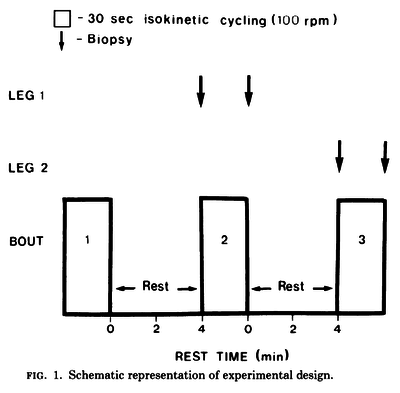
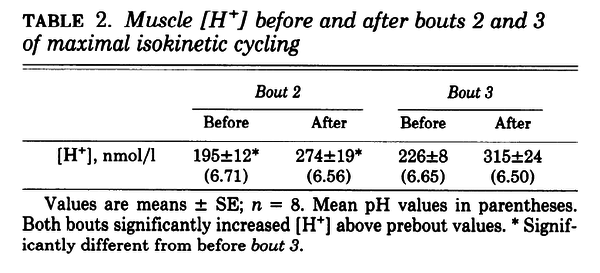
Figure and table from (Spriet et al., 1989) [18], maximal cycling for 30 s, each separated by 4 min of rest
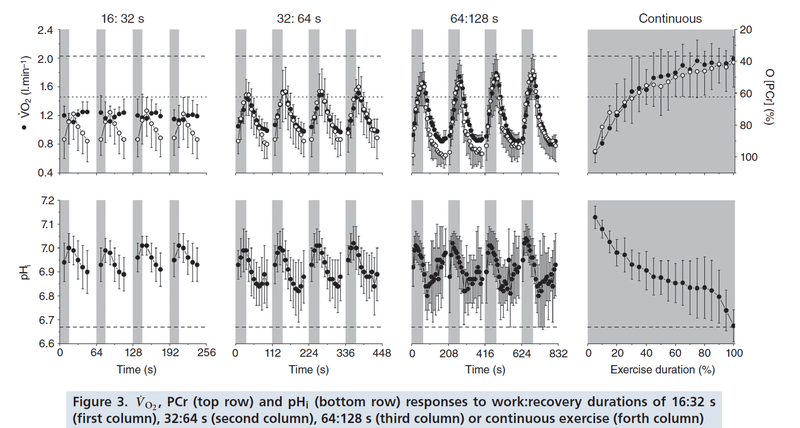
Figure from (Davies et al., 2017) [19], PCr and pH responses to intermittent or continuous exercise.
Figure from (Chidnok et al., 2013) [20], Muscle [PCr] and pH responses during high-intensity intermittent exercise.
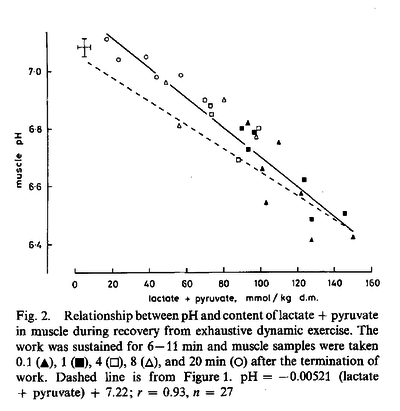
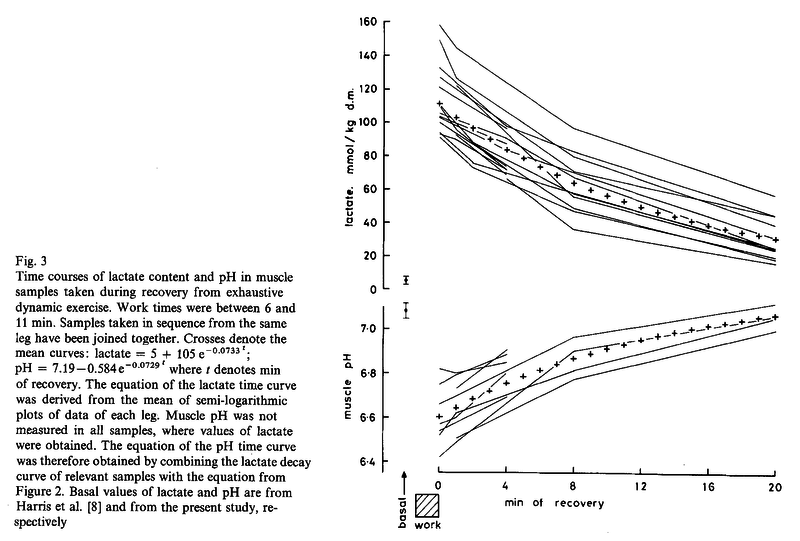
Overall, MRS studies show pH recovery is too fast compared to studies that used biochemical pH measurements, see below.
Figures from (Sahlin et al., 1976) [21],
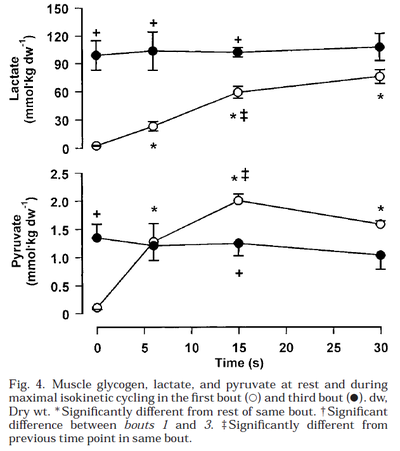
Table from (Parolin et al., 1999) [12].
Figure from (Parolin et al., 1999) [12].
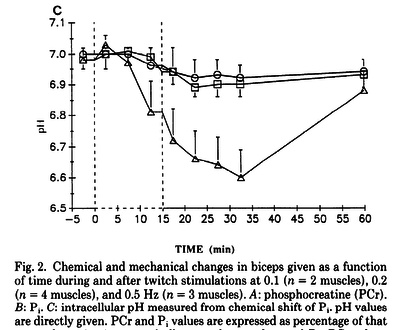
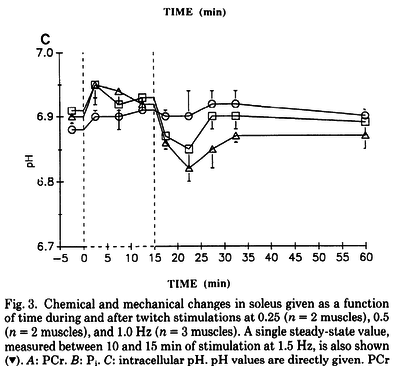
Figures from (Kushmerick et al., 1992) [12], Data from cat muscles, The time courses of changes in intracellular pH during stimulation at the various rates for the biceps and for the soleus.
References
- Broxterman RM, Layec G, Hureau TJ, Morgan DE, Bledsoe AD, Jessop JE, Amann M, and Richardson RS. Bioenergetics and ATP Synthesis during Exercise: Role of Group III/IV Muscle Afferents. Med Sci Sports Exerc. 2017 Dec;49(12):2404-2413. DOI:10.1249/MSS.0000000000001391 |
- Bartlett MF, Fitzgerald LF, Nagarajan R, Hiroi Y, and Kent JA. Oxidative ATP synthesis in human quadriceps declines during 4 minutes of maximal contractions. J Physiol. 2020 May;598(10):1847-1863. DOI:10.1113/JP279339 |
- Layec G, Bringard A, Vilmen C, Micallef JP, Fur YL, Perrey S, Cozzone PJ, and Bendahan D. Accurate work-rate measurements during in vivo MRS studies of exercising human quadriceps. MAGMA. 2008 May;21(3):227-35. DOI:10.1007/s10334-008-0117-3 |
- Cannon DT, Bimson WE, Hampson SA, Bowen TS, Murgatroyd SR, Marwood S, Kemp GJ, and Rossiter HB. Skeletal muscle ATP turnover by 31P magnetic resonance spectroscopy during moderate and heavy bilateral knee extension. J Physiol. 2014 Dec 1;592(23):5287-300. DOI:10.1113/jphysiol.2014.279174 |
- Fiedler GB, Schmid AI, Goluch S, Schewzow K, Laistler E, Niess F, Unger E, Wolzt M, Mirzahosseini A, Kemp GJ, Moser E, and Meyerspeer M. Skeletal muscle ATP synthesis and cellular H(+) handling measured by localized (31)P-MRS during exercise and recovery. Sci Rep. 2016 Aug 26;6:32037. DOI:10.1038/srep32037 |
- Schocke MF, Esterhammer R, Arnold W, Kammerlander C, Burtscher M, Fraedrich G, Jaschke WR, and Greiner A. High-energy phosphate metabolism during two bouts of progressive calf exercise in humans measured by phosphorus-31 magnetic resonance spectroscopy. Eur J Appl Physiol. 2005 Jan;93(4):469-79. DOI:10.1007/s00421-004-1233-z |
- Greiner A, Esterhammer R, Bammer D, Messner H, Kremser C, Jaschke WR, Fraedrich G, and Schocke MF. High-energy phosphate metabolism in the calf muscle of healthy humans during incremental calf exercise with and without moderate cuff stenosis. Eur J Appl Physiol. 2007 Mar;99(5):519-31. DOI:10.1007/s00421-006-0379-2 |
- Larsen RG, Maynard L, and Kent JA. High-intensity interval training alters ATP pathway flux during maximal muscle contractions in humans. Acta Physiol (Oxf). 2014 May;211(1):147-60. DOI:10.1111/apha.12275 |
- Layec G, Trinity JD, Hart CR, Kim SE, Groot HJ, Le Fur Y, Sorensen JR, Jeong EK, and Richardson RS. Impact of age on exercise-induced ATP supply during supramaximal plantar flexion in humans. Am J Physiol Regul Integr Comp Physiol. 2015 Aug 15;309(4):R378-88. DOI:10.1152/ajpregu.00522.2014 |
- Walter G, Vandenborne K, Elliott M, and Leigh JS. In vivo ATP synthesis rates in single human muscles during high intensity exercise. J Physiol. 1999 Sep 15;519 Pt 3(Pt 3):901-10. DOI:10.1111/j.1469-7793.1999.0901n.x |
- Schmitz JP, Groenendaal W, Wessels B, Wiseman RW, Hilbers PA, Nicolay K, Prompers JJ, Jeneson JA, and van Riel NA. Combined in vivo and in silico investigations of activation of glycolysis in contracting skeletal muscle. Am J Physiol Cell Physiol. 2013 Jan 15;304(2):C180-93. DOI:10.1152/ajpcell.00101.2012 |
- Parolin ML, Chesley A, Matsos MP, Spriet LL, Jones NL, and Heigenhauser GJ. Regulation of skeletal muscle glycogen phosphorylase and PDH during maximal intermittent exercise. Am J Physiol. 1999 Nov;277(5):E890-900. DOI:10.1152/ajpendo.1999.277.5.E890 |
- Grassi B. Delayed metabolic activation of oxidative phosphorylation in skeletal muscle at exercise onset. Med Sci Sports Exerc. 2005 Sep;37(9):1567-73. DOI:10.1249/01.mss.0000177472.67419.0a |
- Richardson RS, Wary C, Wray DW, Hoff J, Rossiter HB, Layec G, and Carlier PG. MRS Evidence of Adequate O₂ Supply in Human Skeletal Muscle at the Onset of Exercise. Med Sci Sports Exerc. 2015 Nov;47(11):2299-307. DOI:10.1249/MSS.0000000000000675 |
- Bangsbo J, Krustrup P, González-Alonso J, and Saltin B. ATP production and efficiency of human skeletal muscle during intense exercise: effect of previous exercise. Am J Physiol Endocrinol Metab. 2001 Jun;280(6):E956-64. DOI:10.1152/ajpendo.2001.280.6.E956 |
- Combes A, Dekerle J, Bougault V, and Daussin FN. Effect of work:rest cycle duration on [Formula: see text] fluctuations during intermittent exercise. J Sports Sci. 2017 Jan;35(1):7-13. DOI:10.1080/02640414.2016.1154591 |
- Hargreaves M, McKenna MJ, Jenkins DG, Warmington SA, Li JL, Snow RJ, and Febbraio MA. Muscle metabolites and performance during high-intensity, intermittent exercise. J Appl Physiol (1985). 1998 May;84(5):1687-91. DOI:10.1152/jappl.1998.84.5.1687 |
- Spriet LL, Lindinger MI, McKelvie RS, Heigenhauser GJ, and Jones NL. Muscle glycogenolysis and H+ concentration during maximal intermittent cycling. J Appl Physiol (1985). 1989 Jan;66(1):8-13. DOI:10.1152/jappl.1989.66.1.8 |
- Davies MJ, Benson AP, Cannon DT, Marwood S, Kemp GJ, Rossiter HB, and Ferguson C. Dissociating external power from intramuscular exercise intensity during intermittent bilateral knee-extension in humans. J Physiol. 2017 Nov 1;595(21):6673-6686. DOI:10.1113/JP274589 |
- Chidnok W, DiMenna FJ, Fulford J, Bailey SJ, Skiba PF, Vanhatalo A, and Jones AM. Muscle metabolic responses during high-intensity intermittent exercise measured by (31)P-MRS: relationship to the critical power concept. Am J Physiol Regul Integr Comp Physiol. 2013 Nov 1;305(9):R1085-92. DOI:10.1152/ajpregu.00406.2013 |
- Sahlin K, Harris RC, Nylind B, and Hultman E. Lactate content and pH in muscle obtained after dynamic exercise. Pflugers Arch. 1976 Dec 28;367(2):143-9. DOI:10.1007/BF00585150 |
- Kushmerick MJ, Meyer RA, and Brown TR. Regulation of oxygen consumption in fast- and slow-twitch muscle. Am J Physiol. 1992 Sep;263(3 Pt 1):C598-606. DOI:10.1152/ajpcell.1992.263.3.C598 |


![Muscle [PCr] and pH responses during high-intensity intermittent exercise](/images/thumb/4/40/Chidnok_2013%2C_Muscle_metabolic_responses_during_highintensity_intermittent_exercise.png/400px-Chidnok_2013%2C_Muscle_metabolic_responses_during_highintensity_intermittent_exercise.png)
